almost 1 mth no blog, on 16 march, VIX triggered a bottom call, and true enough global mkt bottom out on 18/03/2011 and did a spectacular V-shape recovery not taking Japan devastation into consideration, increasing high oil prices........middle east violence.......
on FB we discuss abt US indices hitting new high before correction with dow a target of 12600 (prediction was 150 pts off) and now we spotted a new trend developement on the monthly charts, Doji Stars............rule of candle sticks says its need confirmation before a trend is reverse so end of april we will know the fate of the US mkts............will it really signal a reversal?
(hmmm dun forget there is a possiblity of a double top in play)
with QE2 coming to an end...............and pple starting to look at the reality, its highly possible
Dow Monthly
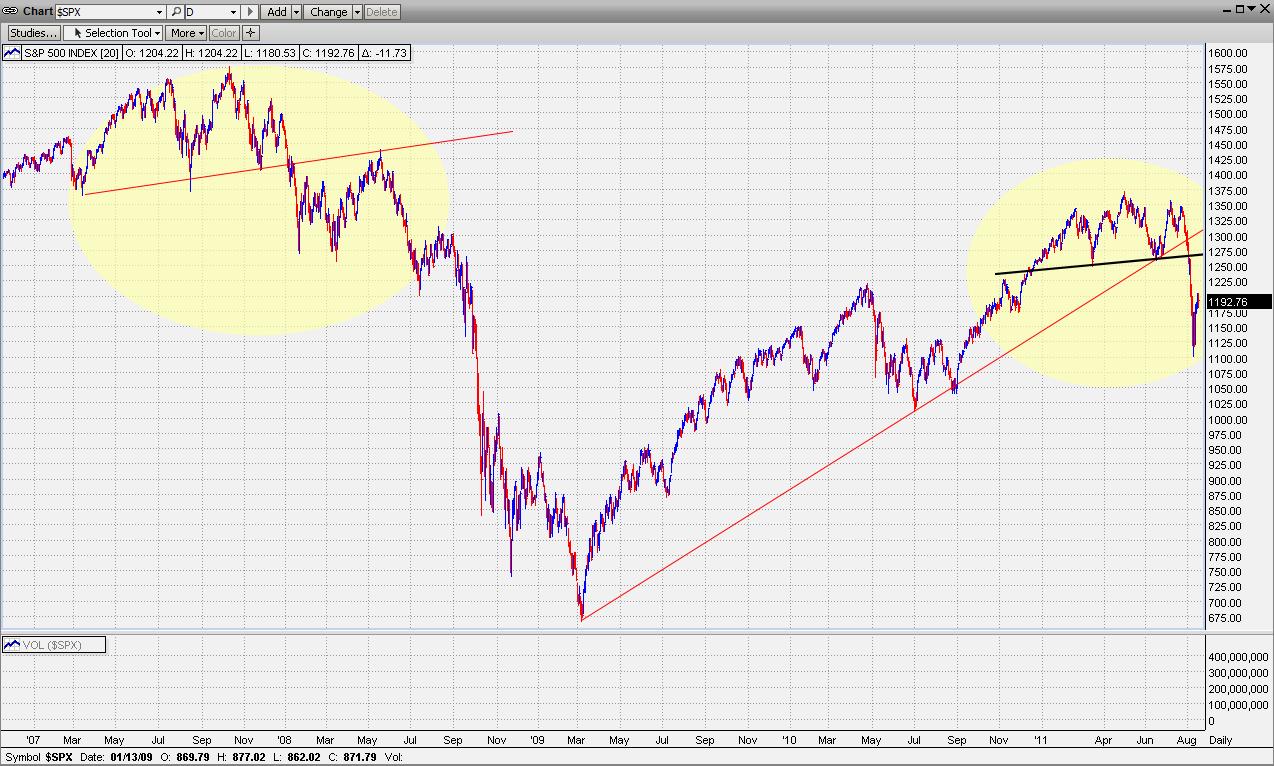
S&P Monthly
Nasdaq monthly
a view of last nite mkt
Come end April i will be able to give all a new prediction of the second half of the mkt.............cheers
happy trading and buyer beware, You have been WARNED
Yours truly
Jacka55


 The Rates are Powered by Forexpros - The Forex Trading Portal

 be careful in this mkt, emphaisis on position sizing!


