The observation of the similarity on the S&P 500 on 2008 top and the top made in 2011 is uncannily similar.....
characteristics of selldown and rebound pattterns has all so been antcipated........so continueing into the next 4 mths will everything be the same........
if using history as a guide and basing upon the same lines if that is to happen..........28dec Bradley key reversal date could spell a new Bear mkt........
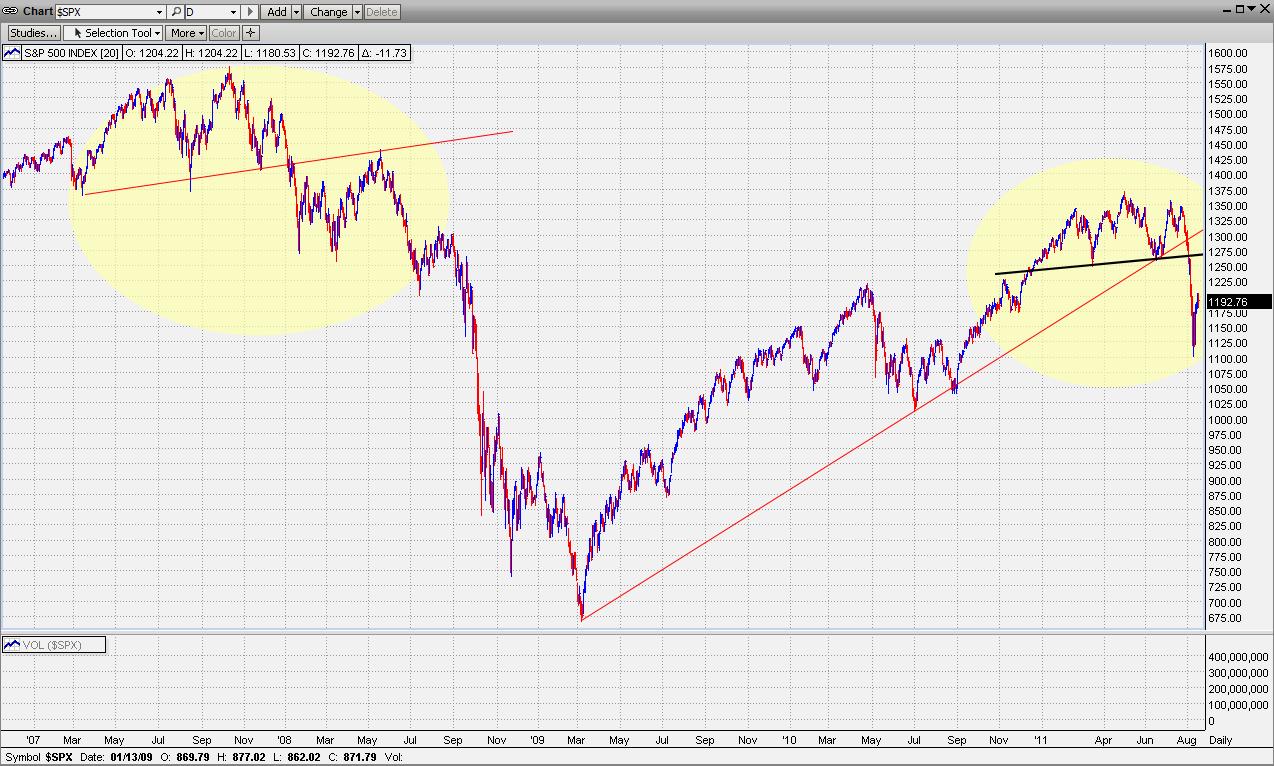
i tend to beleive History do tell us a story...........this is a mkt phenomenom.
trade safe, position sizing is key in this volatile mkts
Have fun
Ian
Wednesday, August 17, 2011
STI, Dow Support and resistence line........Are we looking at a Bear Rally or a Bearish Flag?
FSSTI
Sysmetrical Triangle Breakdown, measurement objective still at 50%, final correction pt stays at 2650
should Rebound push all the way above 3000, pictures should change. at the moment status quo...
DOW Ind
looking kinda obvious a bear flag is forming, alittle too obvious, there is a 50% chance to surpirse to the upside.
no change still expecting a retest of lows before a decent bounce abt 1250-60
Monday, August 08, 2011
HYPOTHESIS COME TRUE!!! HOLY SHIT
On Aug 3, i posted the Hypothesis chart on whether this will happen, and it did happen.........the above is the update.......this is Rape......
Trade safe..........Trade safe with good discipline, mkt is always there, mkt not rite dun have to trade........
IAN
Trade safe..........Trade safe with good discipline, mkt is always there, mkt not rite dun have to trade........
IAN
Friday, August 05, 2011
Jesse Livermore was dead rite: "Human emotions collectively had major impacts on the movement of stock prices and mkts in general, ultimately creating patterns that kept repeating!
2011 current
2007
Amazing resemblance
When everyone try to go out the same door this is what happens
2007
Amazing resemblance
When everyone try to go out the same door this is what happens
Wednesday, August 03, 2011
Charts on Dow & S&P500
too deep a correction may trigger QE3
trade well, position sizing is critical...........cheers
Ian Li
Thursday, July 28, 2011
Tuesday, July 12, 2011
STI charts as of July 12
Indicators have turn down
Support and resisitence level
What if that critical pts breaks?
Support and resisitence level
What if that critical pts breaks?
Subscribe to:
Posts (Atom)
Live Indices
Live World Indices are Powered by Forex Pros - The Forex Trading Portal.


be careful in this mkt, emphaisis on position sizing!


